сайт заговорив ретороманською: petil.net/rm/ — переклад машинний, носії мови ще не вичитували
EQUIPMENT
Gateway: GW3010
Wind: WS68
Rain (tipping bucket): WH40H
Air temperature and humidity: WN31
Lightning detector: WH57
Soil temperature: WN34
Wind: WS68
Rain (tipping bucket): WH40H
Air temperature and humidity: WN31
Lightning detector: WH57
Soil temperature: WN34
NETWORKS
Visitors:

ABOUT
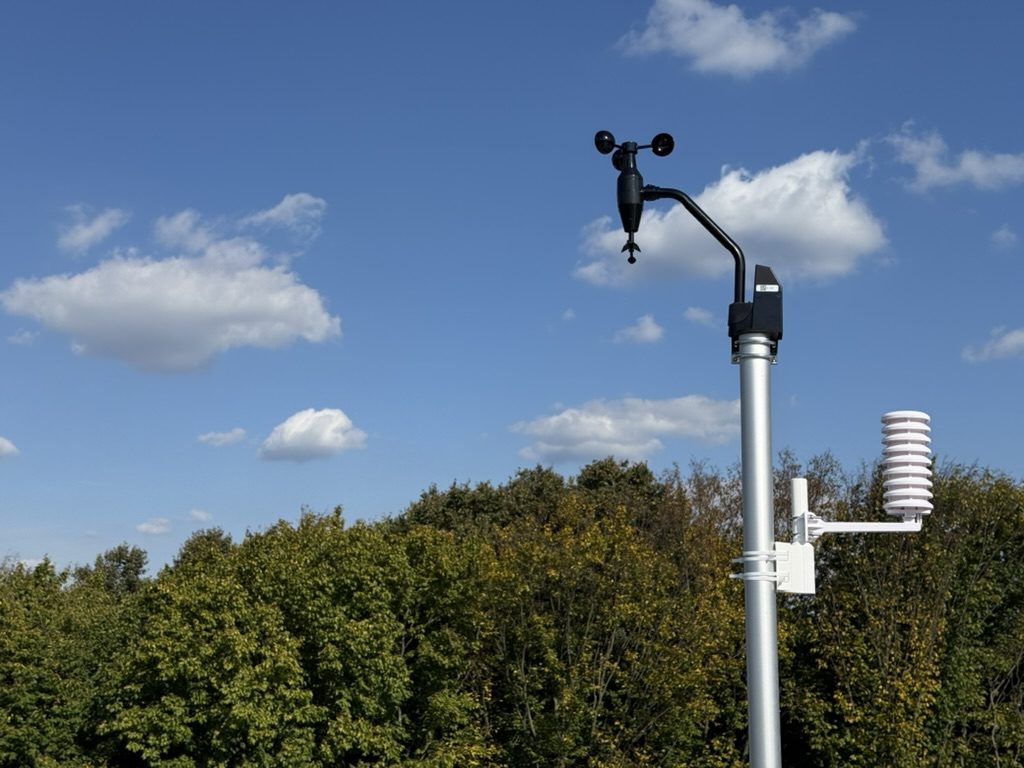
Hi! I watch the weather in the Petil stream valley. Here are the readings from my yard, experiments and notes on the local microclimate.
About the station »
About the station »
« Back · Generated 17.11.2026 00:11 · methodology 2026.10-v3 · final
October 2026
01.10.2026 – 31.10.2026 · 31 of 31 days
Summary
- Mean air temperature at 2 m was +10.4 °C (time-weighted over 31 days).
- Lowest recorded temperature +1.1 °C (15.10 01:28), highest +23.0 °C (08.10 14:46).
- Recorded 51.2 mm of rain over 11 wet days (≥ 1 mm).
- Largest daily total 11.8 mm (23.10), largest hourly 4.5 mm.
- Longest dry spell (< 1 mm/day): 8 days.
- Maximum gust at the installation point 8.2 m/s (20.10 14:51); mean speed 0.8 m/s, calm 46 % of the time.
- 278 hours with RH ≥ 95 %.
- Mean soil temperature at −10 cm +13.2 °C.
- Over 536 common synoptic hours the station was on average 0.8 °C colder than Kyiv (33345); at night the difference was -1.5 °C (204 hours).
- Forecast vs fact (frozen at 18:00; 30 days common to all models): the smallest error was ECMWF AIFS — MAE 1.24 °C, night-minimum bias +1.8 °C.
Completeness and limitations

| T | RH | P | U | R | G | Ts | Days with valid mean | gap in the night minimum |
|---|---|---|---|---|---|---|---|---|
| 100 % | 100 % | 100 % | 100 % | 100 % | 100 % | 100 % | 31 / 31 | 0 |
Air temperature (2 m)

| Mean (time-weighted) | +10.4 °C | Mean daily max / min | +15.2 / +6.5 °C |
| Abs. max | +23.0 °C 08.10 14:46 | Abs. min | +1.1 °C 15.10 01:28 |
| Warmest night (max TN) | +12.1 °C 18.10 | Coldest day (min TX) | +8.5 °C 31.10 |
| DTR (mean / max) | 8.7 / 16.4 °C | Frost hours / cold sum | 0 h / 0 °C·h |
| Days: frost (TN<0) / ice (TX<0) | 0 / 0 | Days: summer (TX>25) / hot (TX≥30) / tropical nights (TN>20) | 0 / 0 / 0 |
| HDD18 / GDD10 | 235 / 39 °C·d | First / last T<0 at 2 m | — |

Precipitation

| Total | 51.2 mm | Days with rain / wet (≥1 mm) / ≥10 / ≥20 | 19 / 11 / 1 / 0 |
| Rx1day | 11.8 mm 23.10 | Rx5day | 24.1 mm 19.10–23.10 |
| Max 1 h / 24 h (rolling) | 4.5 / 12.5 mm | CDD / CWD | 8 / 4 days |
| SDII | 4.4 mm/wet day | Unknown days | 0 |
Largest rain events: 17.10 15:10 — 16.6 mm in 41.0 h, I10 10.2 mm/h; 23.10 03:38 — 11.8 mm in 9.9 h, I10 6.1 mm/h; 29.10 06:33 — 8.7 mm in 3.1 h, I10 6.6 mm/h; 16.10 07:12 — 3.3 mm in 6.3 h, I10 2.3 mm/h; 09.10 15:57 — 1.7 mm in 1.2 h, I10 4.1 mm/h
Totals are increments of the WH40H cumulative counter; unknown intervals are not replaced by zero. The gauge is unheated: winter totals may not reflect real precipitation.
Wind at the installation point


| Mean speed | 0.8 m/s | Max gust | 8.2 m/s 20.10 14:51 |
| Wind run | 2047 km | Calm (<0.5 m/s) | 46 % |
| Prevailing direction (vector) | NNE | Western sector share | 14 % |
The western sector is in a wind shadow. Direction at U < 0.5 m/s is ignored. Gusts are per-minute packet maxima, not the standard 3-second gust.
Pressure
| Mean (MSL) | 1021.3 hPa | Min / max | 1008.4 11.10 20:29 / 1037.0 02.10 10:53 hPa |
| Fastest 3 h fall / rise | -2.5 08.10 15:07 / +2.9 12.10 10:50 hPa | Rapid-fall episodes (≤ −4 hPa/3 h) | 0 |
Solar radiation estimate (WS68) and UV
| Period total | 166 MJ/m² | Daily mean | 5.4 MJ/m² |
| Sunniest / dullest day | 13.1 01.10 / 1.0 18.10 | Max G / UV index | 737 W/m² / 6 |
Estimate from the unverified WS68 pyranometer; 'sunshine hours' are not computed (the standard criterion applies to direct radiation).
Humidity
| RH mean / min / max | 88 / 40 / 99 % | Hours RH ≥ 95 % / nights ≥ 3 h | 278 / 24 |
| Dew point min / max | +0.2 / +15.1 °C | VPD mean | 0.16 kPa |
Soil (−10 cm)

| Mean / min / max | +13.2 / +10.9 / +14.9 °C | Daily amplitude / As÷AT | 0.6 °C / 0.07 |
| Days Ts > 5 / > 10 °C | 31 / 31 | Hours Ts < 0 | 0 |
Comparison with Kyiv (33345)
| Common hours | ΔT mean | median | night (n) | day (n) | independent nights |
|---|---|---|---|---|---|
| 536 | -0.8 °C | -0.2 °C | -1.5 (204) | +0.1 (199) | 31 |
Kyiv SYNOP is a simultaneous external reference, not a climate normal. The difference includes the urban effect, terrain, exposure, forest influence and instrument errors; it must not be called a 'forest-edge effect'.
Forecast verification
| Model | days | MAE | bias | RMSE | |e|>2 | Tмін bias | Tмін MAE | Δtmin |
|---|---|---|---|---|---|---|---|---|
| ECMWF AIFS | 31 (30) | 1.22 | +0.65 | 1.66 | 22 % | +1.75 | 1.84 | 2.6 h |
| ICON-EU | 30 | 1.27 | +0.88 | 1.87 | 21 % | +1.99 | 2.01 | 2.5 h |
| ECMWF IFS | 31 (30) | 1.45 | +1.03 | 1.87 | 26 % | +1.64 | 1.91 | 1.9 h |
| GFS | 31 (30) | 1.97 | +1.59 | 2.70 | 37 % | +2.33 | 2.60 | 2.2 h |
| Persistence (yesterday, same hour) | 31 | 2.13 | +0.09 | |||||
By lead time (MAE, °C)
| Model | 6 h | 12 h | 24 h | 48 h |
|---|---|---|---|---|
| ECMWF AIFS | 1.22 (130) | 1.23 (129) | 1.18 (127) | 1.23 (123) |
| ECMWF IFS | 1.47 (130) | 1.54 (129) | 1.47 (127) | 1.48 (123) |
| GFS | 2.00 (129) | 2.05 (128) | 2.11 (126) | 2.19 (122) |
| ICON-EU | 1.44 (261) | 1.43 (259) | 1.45 (255) | 1.59 (122) |


Operational mode: every day at 18:00 the latest available run of each model is frozen and the following night (20:00–08:00) and day are scored. Models are scored on different numbers of days; the figure in brackets is the number of days common to all models — models can only be compared with each other on those. 'Persistence' is the baseline: the temperature at the same hour of the previous day, using only data known at 18:00 (for hours after 18:00, the day before yesterday).
Station changes in the period
09.10
05.10
Оновлено сайт: нова методика розрахунків (часові ваги, опади з лічильника, контроль повноти), архів спостережень за кожну добу, автоматичні звіти за місяць/сезон/рік, перевірка прогнозів за запусками моделей і прогноз на дві доби на головній.
05.10
Мобільна версія: компактна шапка, згорнуте меню, поточні умови з мінімумом і максимумом на першому екрані, збільшення графіків по натисканню.
Data download
daily.csv (all daily aggregates) · 2026-10.json (this report's figures)
Best viewed 800×600UNDER CONSTRUCTIONPowered by SQLite + Python
© 2026 Petil PWS · Data provided as is, no warranty · Contact the owner:
[email protected]