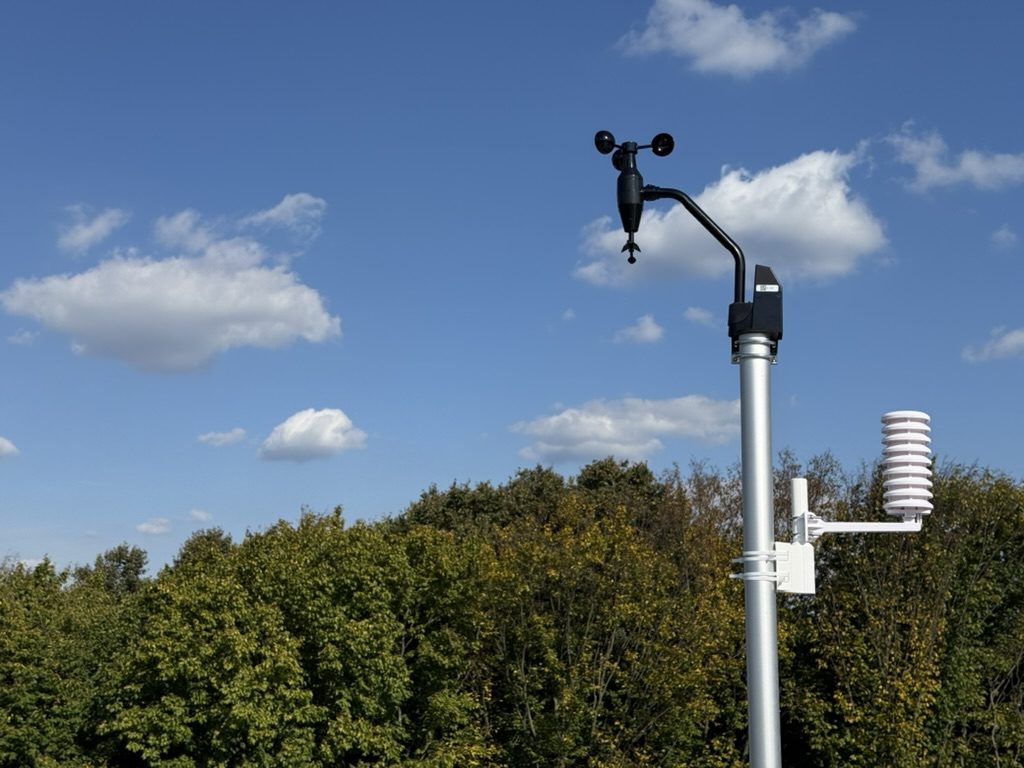
Wind: WS68
Rain (tipping bucket): WH40H
Air temperature and humidity: WN31
Lightning detector: WH57
Soil temperature: WN34

About the station »
How we measure the weather
Methodology 2026.10-v3
This page explains where Petil PWS data comes from, how the figures are computed and what to keep in mind when reading the reports. The rules are the same for every period. When they change, the methodology version changes with them.
Where the data comes from
The home station reports every minute. The original readings are stored in the database as they are, with no calibration corrections, so any figure can be traced back and recomputed.
Sensor placement:
- Air temperature and humidity — at 2 m, in a shield against direct sun.
- Soil temperature — at 10 cm depth.
- Wind, solar radiation and UV index — on a mast, 10 m above ground.
- Precipitation — a rain gauge at 2 m.
- Lightning — a separate WH57 detector.
For comparison we use the observations of the Kyiv weather station, code 33345. Its SYNOP reports arrive through Ogimet at three-hour intervals.
Forecasts come from four models through Open-Meteo: ECMWF IFS 0.25°, ECMWF AIFS, ICON-EU and GFS. Since 5 October 2026 they are stored with a reference to the specific model run (the run archive was restored back to late September). Before that, hourly downloads were kept without such a reference.
Which time is used
All dates and hours on the site are Kyiv time. A day runs from midnight to the next midnight. Daylight-saving changes are taken into account: those days last 23 or 25 hours.
For verifying the night-minimum forecast, the night is defined as 20:00 to 08:00 the next day.
What happens when data is missing
The link to the sensors or the server occasionally drops. Such gaps are accounted for separately for temperature, rain, wind and the other variables.
A mean is published only when there is enough data:
- for an hour — at least 80 % of the expected readings;
- for a day — at least 90 %, with no break longer than an hour.
Otherwise a dash is shown instead of the mean. Calculations weight each reading by the time interval it covers; a value is never carried forward across a gap longer than an hour.
Minimum and maximum are shown from the readings available. If there was a break of 20 minutes or more between 02:00 and 08:00, the minimum is flagged: the true lowest temperature may have fallen into that gap.
The data completeness percentage is given in every report. These thresholds are the project's own processing rules, not a claim of conformity to WMO standards.
Temperature
The mean temperature is computed from the readings over the day, weighted by time. It is not simply the half-sum of the minimum and maximum.
Reports show the highest and lowest temperature with their times, and the mean daily maxima and minima. The diurnal range, DTR, is the difference between the day's highest and lowest temperature.
Also counted:
- frost days — the temperature fell below 0 °C at least once;
- ice days — even the maximum stayed below 0 °C;
- summer days — the maximum exceeded +25 °C;
- hot days — the maximum reached +30 °C or more;
- tropical nights — the daily minimum stayed above +20 °C.
The duration of frost and the accumulated cold are tracked separately. For example, one hour at −3 °C adds 3 degree-hours of cold.
HDD18 and GDD10 describe accumulated cold or warmth from daily means. A day with a mean of +15 °C adds 3 degree-days to HDD18 and 5 to GDD10. If the threshold is not crossed, the contribution is zero. Days without a valid mean are excluded from these sums.
Temperature is measured at 2 m. So "frost" on this site refers to the air at that height: near the grass or the soil surface the temperature may differ.
Precipitation
The rain gauge accumulates the water that passes through it in 0.1 mm steps. Totals are derived from the change of this counter, taking resets into account.
Missing readings do not mean no rain. When part of the rainfall cannot be recovered, the report says "at least … recorded".
Besides the total, the following are computed:
- wet days — at least 1 mm fell;
- Rx1day — the largest daily total;
- Rx5day — the largest total over five consecutive days;
- the largest totals over any consecutive 1 and 24 hours;
- CDD and CWD — the longest runs of dry and wet days;
- SDII — the mean rainfall per wet day.
For these indices a day with less than 1 mm counts as dry. It was not necessarily rain-free. A day with an unknown total breaks a confirmed run.
A new rain event starts after at least six hours without recorded rain. Its peak intensity is taken from the heaviest ten minutes and shown in mm/h.
The gauge has the limitations of a mechanical instrument. It registers rain in 0.1 mm portions: a very short shower or light drizzle may not supply enough water for the first tip, and some water stays on the funnel surface and evaporates. So 0.0 mm does not always mean there was no rain at all — reports describe such cases as "0.0 mm recorded", often alongside hours with humidity of 95 % and above. Wind can reduce the catch; no wind correction is applied.
There is no heating, so in winter snow may not be registered or may be counted only after it melts. A laser snow-depth sensor is planned for a future version of the station.
Wind
The mean speed, the highest recorded gust and the distribution by direction are shown.
Speeds below 0.5 m/s are treated as calm. The share of such time is given separately; the direction under these conditions is not used to determine the prevailing wind.
The wind rose shows how often the wind blew from each of 16 directions and at what speed. Wind run is the notional distance the air would have travelled at the measured speed. For example, a steady 1 m/s wind for an hour gives 3.6 km of run.
Gusts are the values reported by the sensor through the gateway. They should not be equated with the standard three-second gusts of professional stations.
The forest shelters the station from the west. So these figures describe the wind at the installation point: in the open field nearby it may be stronger.
Atmospheric pressure
The site uses pressure reduced to sea level according to the station setting. This makes it easier to compare with weather maps and other stations.
The three-hour change is computed from the pressure measured directly by the sensor. If the value "three hours ago" is missing because of a gap, no change is shown. A fall of 4 hPa or more in three hours is flagged as rapid. So that one long event is not counted many times, separate episodes are at least 12 hours apart.
A pressure fall alone is not enough to confidently declare the passage of a front.
Solar radiation and UV
The WS68 sensor measures solar radiation and the UV index. From the readings over the day, the solar energy received is computed in MJ/m².
This is an estimate from an uncalibrated amateur sensor. Sunshine hours are not computed: the standard definition requires direct-beam measurement, while this sensor also sees diffuse light.
Humidity
From temperature and relative humidity the dew point is computed — the temperature to which the air must cool to become saturated with water vapour.
VPD — vapour pressure deficit — is also computed. It shows how far the air is from saturation: a larger value means a stronger drying capacity.
Hours with humidity 95 % and above are counted separately. This is near-saturated air, not proof of fog: confirming fog requires visibility observations.
Soil temperature
The sensor is at 10 cm depth. Reports give the mean, minimum, maximum and daily swing.
A crossing of 0, +5 or +10 °C counts as steady when the daily mean stays on the new side of the threshold for five consecutive days and was on the other side the day before. The date of the crossing is the first of those five days.
A sub-zero reading at 10 cm describes the state at the measurement point. One sensor cannot determine the full frost depth.
Lightning
The WH57 registers signals it recognises as lightning and roughly estimates the distance to the last trigger.
The site shows the number of detector triggers per day. This is not an exact count of all strikes around the station: misses and responses to interference are possible.
Comparison with Kyiv
Temperature is compared only at the times for which the Kyiv station has observations. For Petil PWS the mean over a ten-minute window is taken — five minutes before and after the synoptic hour.
A positive difference means it is warmer here than in Kyiv, negative — colder. Results are shown separately for night hours (21:00, 00:00, 03:00) and day hours (09:00, 12:00, 15:00), with the number of comparisons and nights.
The difference may be due to terrain, buildings, the forest, sensor placement and sensor errors. It cannot be attributed entirely to the forest edge.
The Kyiv observations here are a same-time reference. A climate normal needs a separate multi-year series.
How forecasts are verified
Two kinds of comparison are used.
Forecast for the next night and day. For each model the forecast as of 18:00 Kyiv time is selected. It is then compared with the following night and the following calendar day. Later updates do not replace it.
The current algorithm assumes a run becomes available about five hours after its start time. This is a working assumption, not a confirmed time of actual receipt.
Forecast a fixed number of hours ahead. Values 6, 12, 24 and 48 hours after the start of each model run are checked separately. Lead times are never mixed.
For the hourly comparison, the measured temperature is averaged over the hour around the stamp — 30 minutes before and after. At least 80 % of the readings are required. The night minimum is taken from minute data. A day enters the statistics if it has at least 18 hours usable for comparison.
Main metrics:
- MAE — the mean size of the error regardless of sign. Lower is better.
- Bias — the mean over- or underestimate. Positive means the forecast was warmer than observed.
- RMSE — a metric that penalises large misses more.
- Share of errors above 2 °C — how often the forecast differed noticeably from the measurements.
- Night-minimum error — how far the model missed the lowest temperature and the time it occurred.
Models are often scored on different numbers of days: a run may not have been available at 18:00. Models are therefore ranked only on common days — those where all models are present — and only if there are at least three such days. Otherwise the individual figures are given without naming the most accurate model.
A simple baseline is shown for comparison: "the temperature will be the same as yesterday at this hour". It too uses only what was known at 18:00: for hours after 18:00 the value from the day before yesterday is taken, because yesterday's had not yet occurred at the time of freezing.
The local correction is derived from the errors of preceding days, separately for day and night. Its benefit is tested on the following days, which were not used in its calculation. Improvement is measured as the reduction in MAE relative to the raw forecast.
How to read records and conclusions
A "record" on this site means the highest or lowest value over this station's period of operation.
The series is still short. It allows describing individual events and looking for local patterns, but not determining a climate normal, a long-term trend or the frequency of rare downpours.
Methodology history
2026.10-v3 — current version. Refined rain accounting, wind and other averaging, gap handling and run-based forecast verification. Regular reports added.
2026.10-v2 — first public version, 3 October 2026. Simple record-based means, the daily rain counter and forecasts without reference to a specific run.
[email protected]