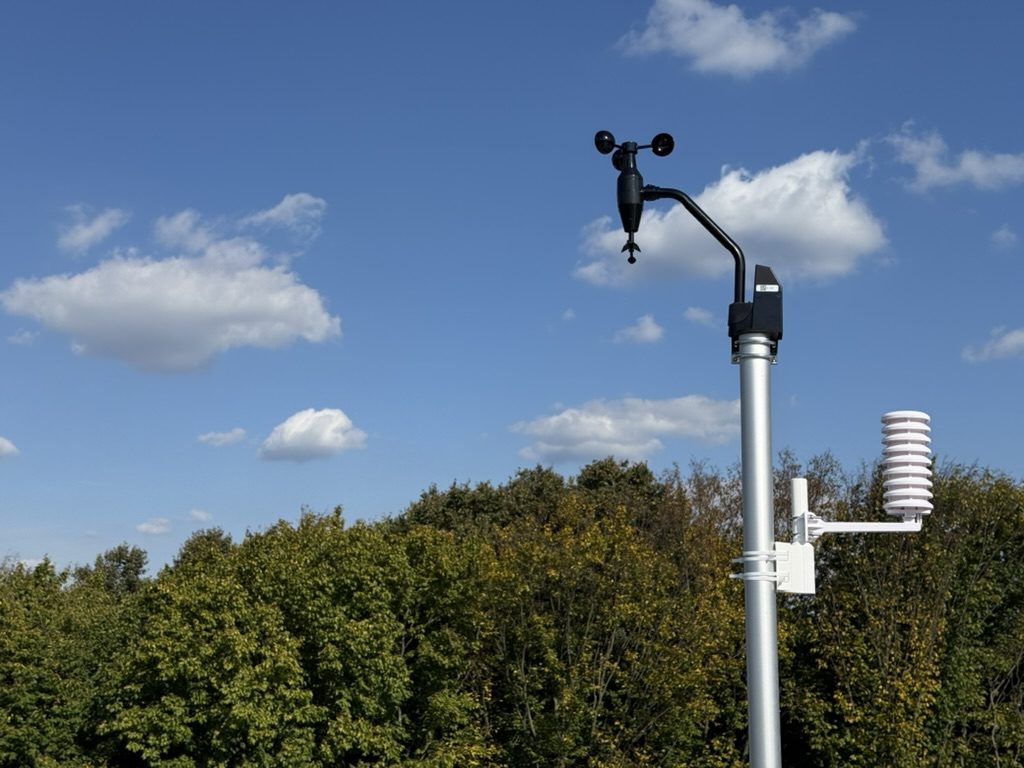
Wind: WS68
Rain (tipping bucket): WH40H
Air temperature and humidity: WN31
Lightning detector: WH57
Soil temperature: WN34

About the station »
Why another weather station near Kyiv
It seems there are home weather stations everywhere. In fact, open the Awekas, WOW or Wunderground maps and you find a few dozen across Ukraine and a handful around Kyiv. Most of them are installed any old how: an anemometer under the eaves or on a fence among trees, a thermometer on the house wall, a rain gauge under a canopy. Such stations show temperature more or less; wind they do not: in a wind shadow it reads several times too low and the direction is random.
This station is set up differently. The anemometer is 10 m above ground on the roof, out of the wind shadow as far as the site allows. The rain gauge is at 2 m in the open. The thermo-hygrometer sits in a radiation shield at 2 m. It is not an all-in-one unit, so every element is where the requirements say it should be, not where a box is convenient to hang. Whatever is still not right is described openly on the About the station page.
The jobs
Work out a method for locally improving forecasts. The big models (ECMWF, ICON, GFS) compute the weather for a grid cell several kilometres across. For a forest edge in a stream valley that gives a systematic error: nights here are regularly 2–4 °C colder than any forecast promises. The station writes the facts every minute, and the forecasts of four models for this very point are stored alongside every hour. In a few weeks it will be clear which model errs and how; in a few months, whether those errors add up to a correction that works. The score is kept in the open: forecast vs fact.
Find the local quirks. When frost arrives on the forest edge compared with the open field, how much wind the forest to the west eats, how soil at 10 cm lags behind the air, what happens to the valley temperature in the hour after sunset. None of this is in any model, and all of it matters to anyone who plants, builds or simply lives in a place like this.
What the site will have
- Current readings and charts, updated every minute.
- An archive of daily summaries and a CSV for your own analysis.
- Forecast vs fact: a daily scoreboard of the models.
- Notes on what worked and what did not.
All data is open. If you run a station nearby, especially a properly sited one, say hello in the guestbook.
[email protected]